

Tools
Protrusion/retraction signal enrichment and protrusion-retraction cycle duration analysis
Dieser Analyseansatz wurde entwickelt, um die Anreicherung von Signalen in Ausstülpungen oder Retraktionen im Verhältnis zum durchschnittlichen Signal in Zellen zu messen (Abbildung 1a, Video 1, Ref. 1). Die Analyse basiert auf dem Open-Source-ImageJ-Plugin ADAPT (Ref. 2), das modifiziert wurde, um das Signal-Rausch-Verhältnis zu erhöhen, indem Signale ausschließlich innerhalb der Zelle gemessen werden (Abbildung 1b–c; Ref. 3). Darüber hinaus wurde die Ausgabe des ADAPT-Plugins automatisch analysiert, um relative Signalanreicherungsprofile in Bezug auf Protrusions- oder Retraktionsereignisse zu extrahieren (Abbildung 1d–e, Ref. 4) sowie die durchschnittliche Dauer von Protrusions-Retraktions-Zyklen zu bestimmen (Ref. 1).
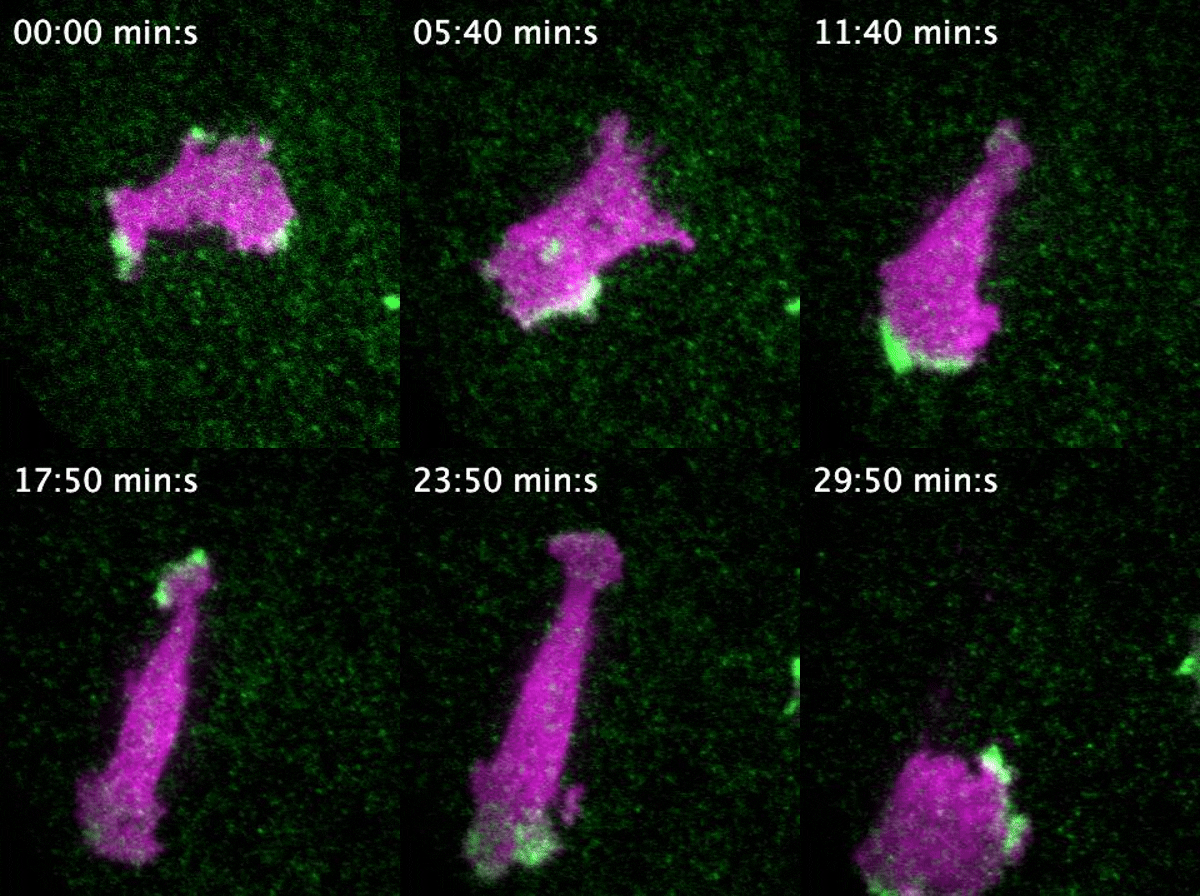
Video 1: Video microscopy of a single cancer cell that dynamically changes its migration direction. The active form of the signal molecule Rac1 (green) is strongly enriched at the cell edge during the protrusion phase and absent during cell retraction. The entire cell is visualised via a volume marker (magenta).

Figure 1: Automated analysis of signal enrichment during protrusion and retraction phases of migrating cells. a Representative image of a cell expressing a cytosolic cell volume marker to visualize the cell attachment area (magenta), and an activity sensor (green). Here a sensor that detects the active form of the signal protein Rac1 was used. The white arrow marks the direction of a local cell protrusion. b Automated tracing of the cell border using a modified version of the ADAPT plugin (Ref 3). c Maps generated by the ADAPT plugin that represent the spatio-temporal dynamics of the activity sensor signal between the green lines in (b) (left) and of the cell edge velocity (right). The yellow arrows in (c) point to the local protrusion that occurs at the position of the cell area marked by the yellow arrow in (b). Red areas in the velocity map correspond to local cell protrusions, blue areas to local cell retractions. d Plot of Rac sensor signals and cell edge velocity corresponding to the yellow dotted line in (c). e Enrichment of the Rac activity sensor signals in protrusions and retractions.
Referenzen
1. Nanda S, Calderon A, Sachan, A, Duong T-T, Koch J, Xin X, Solouk-Stahlberg D, Wu Y-W, Nalbant P, Dehmelt L:
Rho GTPase activity crosstalk mediated by Arhgef11 and Arhgef12 coordinates cell protrusion-retraction cycles.
Nat Commun, 14:8356 (2023) (corresponding author)
2. Barry, D. J., Durkin, C. H. & Abella, J. v & Way, M.
Open source software for quantification of cell migration, protrusions, and fluorescence intensities.
J. Cell Biol. 209, 163–180 (2015).
3. Nanda et al. Adapt edge analysis modification. Github.
4. Nanda et al. Protrusion retraction enrichment analysis. Github.
NeuriteQuant
Ein Open-Source-Toolkit für High-Content-Screens der neuronalen Morphogenese.
NeuriteQuant ist ein frei verfügbares Open-Source-Werkzeug, das die automatisierte Analyse neuronaler Morphologien ermöglicht [1]. Es unterstützt sowohl die Analyse einzelner Experimente als auch groß angelegte High-Content-Screens. Die Analyse-Pipeline ist insbesondere darauf optimiert, den Einfluss experimenteller Manipulationen auf physiologisch relevante neuronale Kulturen zu quantifizieren, die einen hohen Grad an Überlappung zwischen Neuriten aufweisen, wie beispielsweise Kulturen aus primären Neuronen, Stammzellen oder Hirnschnitten.
